


今日も、Matplotlib を学ぶ。
試しにきれいなグラフをつくってみようかと思ったけど、
きれいな感じにはならなかった。
■AIを学ぶ為の本格Python講座
PY22_Matplotlib_見た目の変更
今日学んだこと
Matplotlibでのいろいろなグラフの書き方
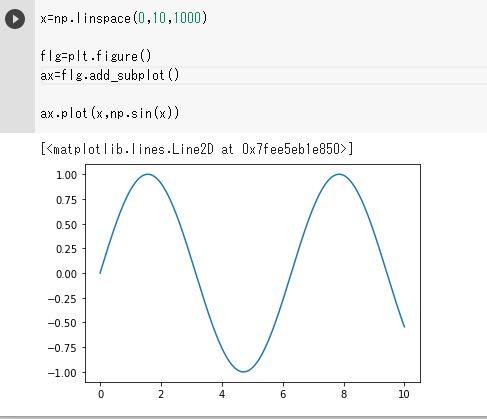
いままでは、そのままplot関数でグラフを描いていたけど、
凡例や細かな表現をするには、以下の書き方にする。
xの値の範囲(0から10で、なめらかさ1000)
x=np.linspace(0,10,1000)
グラフを描くスペースの作成(白紙の紙みたいなもの)
flg=plt.figure()
グラフの元の作成
ax=flg.add_subplot()
グラフを描く
ax.plot(x,np.sin(x))
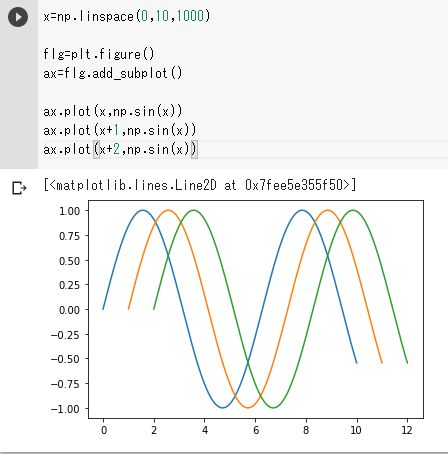
同じ場所に複数のグラフを描ける
x=np.linspace(0,10,1000)
flg=plt.figure()
ax=flg.add_subplot()
ax.plot(x,np.sin(x))
ax.plot(x+1,np.sin(x))
ax.plot(x+2,np.sin(x))
なんかきれい。
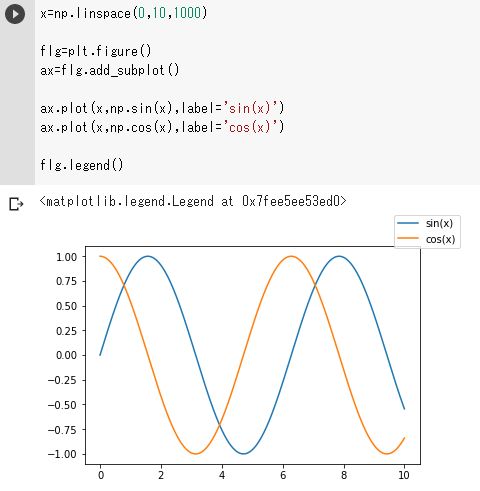
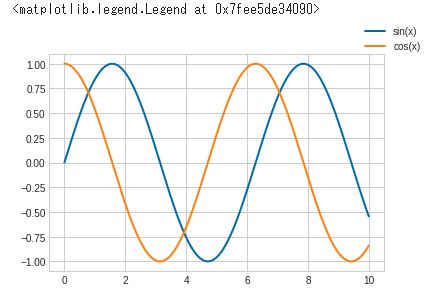
凡例(label)を表現
x=np.linspace(0,10,1000)
flg=plt.figure()
ax=flg.add_subplot()
label=、でラベルを指定してあげる。
ax.plot(x,np.sin(x),label='sin(x)')
ax.plot(x,np.sin(x),label='cos(x)')
ラベルを描く
flg.legend()
グラフのデザイン
matplotにはグラフのデザイン(テーマ)があり、
そのテーマを使うとデザインを変更できる。
テーマを指定する。(seaborn-bright)
plt.style.use('seaborn-bright')
x=np.linspace(0,10,1000)
flg=plt.figure()
ax=flg.add_subplot()
ax.plot(x,np.sin(x),label='sin(x)')
ax.plot(x,np.cos(x),label='cos(x)')
flg.legend()
青色基調のグラフになった。

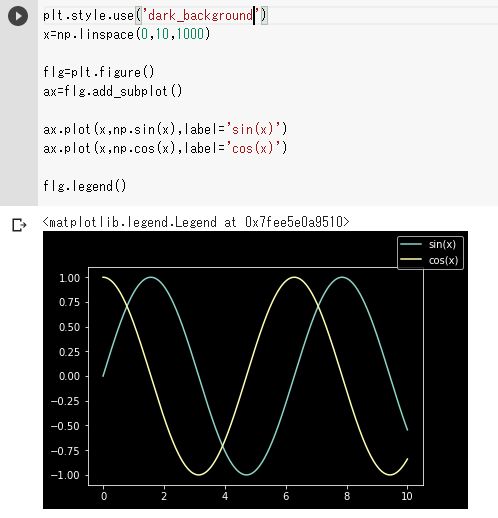
dark_background 背景が黒のものを描ける。
plt.style.use('dark_background')
x=np.linspace(0,10,1000)
flg=plt.figure()
ax=flg.add_subplot()
ax.plot(x,np.sin(x),label='sin(x)')
ax.plot(x,np.cos(x),label='cos(x)')
flg.legend()
plt.style.availableで、どんなテーマを使えるか見れる。
plt.style.available
⇒
['Solarize_Light2',
'_classic_test_patch',
'bmh',
'classic',
'dark_background',
'fast',
'fivethirtyeight',
'ggplot',
'grayscale',
'seaborn',
'seaborn-bright',
'seaborn-colorblind',
'seaborn-dark',
'seaborn-dark-palette',
'seaborn-darkgrid',
'seaborn-deep',
'seaborn-muted',
'seaborn-notebook',
'seaborn-paper',
'seaborn-pastel',
'seaborn-poster',
'seaborn-talk',
'seaborn-ticks',
'seaborn-white',
'seaborn-whitegrid',
'tableau-colorblind10']
試してみる。
ggplot 背景灰色で罫線が出てきた。
plt.style.use('ggplot')
x=np.linspace(0,10,1000)
flg=plt.figure()
ax=flg.add_subplot()
ax.plot(x,np.sin(x),label='sin(x)')
ax.plot(x,np.cos(x),label='cos(x)')
flg.legend()
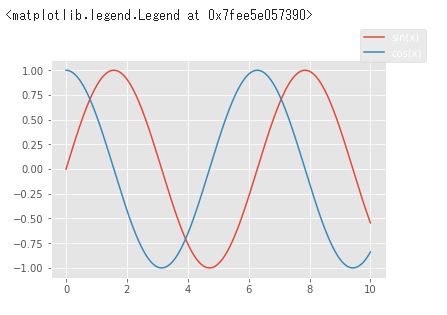
tableau-colorblind10 罫線が出ただけかな?
plt.style.use('tableau-colorblind10')
x=np.linspace(0,10,1000)
flg=plt.figure()
ax=flg.add_subplot()
ax.plot(x,np.sin(x),label='sin(x)')
ax.plot(x,np.cos(x),label='cos(x)')
flg.legend()
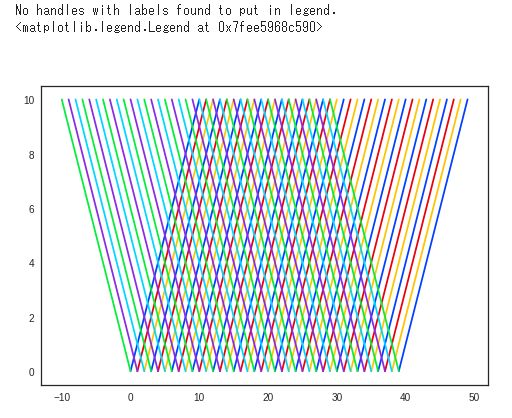
for文を使って、模様を描いてみた
plt.style.use('seaborn-white')
x=np.linspace(0,10,1000)
flg=plt.figure()
ax=flg.add_subplot()
for i in range(0,40):
ax.plot(x+i,x)
ax.plot(-x+i,x)
flg.legend()
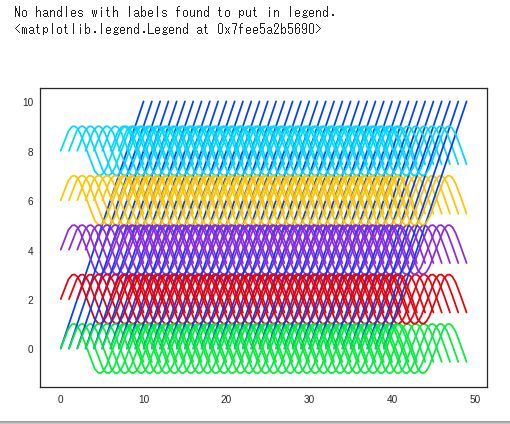
plt.style.use('seaborn-white')
x=np.linspace(0,10,1000)
flg=plt.figure()
ax=flg.add_subplot()
for i in range(0,40):
ax.plot(x+i,x)
ax.plot(x+i,np.sin(x))
ax.plot(x+i,np.sin(x)+2)
ax.plot(x+i,np.sin(x)+4)
ax.plot(x+i,np.sin(x)+6)
ax.plot(x+i,np.sin(x)+8)
flg.legend()
勉強時間
今日: 1.0時間
総勉強時間: 35.0時間
お得キャンペーンの紹介
ラビットチャレンジの
Amazonギフト券「5,000円」プレゼントキャンペーンのお知らせ
申込時に、以下コードを使えば、入会金が5000円引かれるようです。
また、紹介した僕にも5000円のAmazonギフト券が送られるようです。
お得なので、よかったら申込時お使いください。
紹介コード:friend0019697
※本キャンペーンの期間は、 2021年9月15日~10月31日 です。
「お友達紹介キャンペーン」特設ページ:
https://ai99